07.16.2024 HData Team
Q: Rick, it’s a pleasure to chat with you. Introduce yourself, what’s your title?
A: I am the Product Management Director, Planning & Regulatory Solutions for PowerPlan.
Prior to my current role, I supported the sales team as a Utility Subject Matter Expert. It was my job to evaluate a utility's current processes and systems and provide recommendations to help them maximize their value and set themselves up well to meet their future goals.
In my current role, I lead a group of specialists that oversee the development of PowerPlan’s Planning and Regulatory software solutions. This is done through collaborative interactions with our customers, industry and functional research, and market evaluations.
I have over 20 years of experience in the utility industry in a variety of accounting, finance, and regulatory roles. I also served as an expert witness in rate cases and special issue filings and in investor relations at the utility’s parent company.
Q: You have a wealth of experience! What about your current company, PowerPlan? What do they do?
A: PowerPlan delivers award-winning software to stakeholders across accounting, tax, finance, operations, and IT departments. It aids them in getting the clarity they need to improve corporate performance. By layering complex regulatory requirements with granular financial and operational data, the tool presents users with a single source of defensible and auditable information.
Q: What role does regulatory data insights play in your work?
A: Regulatory data insights play a big role at PowerPlan and in the work that I specifically do. In my current role, regulatory insights help advise potential industry trends and challenges we may be able to address with current or new software solutions. It shapes our customer discovery, provides hypotheses to explore, and uncovers new sales opportunities.
When I’m preparing to present at conferences, writing articles or whitepapers, or getting ready to speak in a webinar, I often use data insights to generate content. It helps me get ready for thoughtful discussions and respond well to questions.
Q: What kinds of tools do you use when gathering energy regulatory data?
A: Day to day, I usually start with news sources and articles in industry-specific publications. I receive regular notifications and emails for utility industry headline stories. That daily review often inspires me to look deeper into specific topics or current events. I frequently deep dive into specific areas. This could be energy or gas supply and demand, market pricing trends, rate case statistics, or financial information from SEC or FERC Filings. This all makes great fodder for presentations and articles and such.
Q: You recently created a presentation using HData. What event was that for? Who was your audience?
A: I recently used HData to create a presentation that covered Industry Trends & Insights. It was for an accounting conference sponsored by the American Gas Association (AGA) and Edison Electric Institute (EEI). Our primary audience was the Budgeting and Financial Forecasting Committee.
Q: What are some highlights from the presentation?
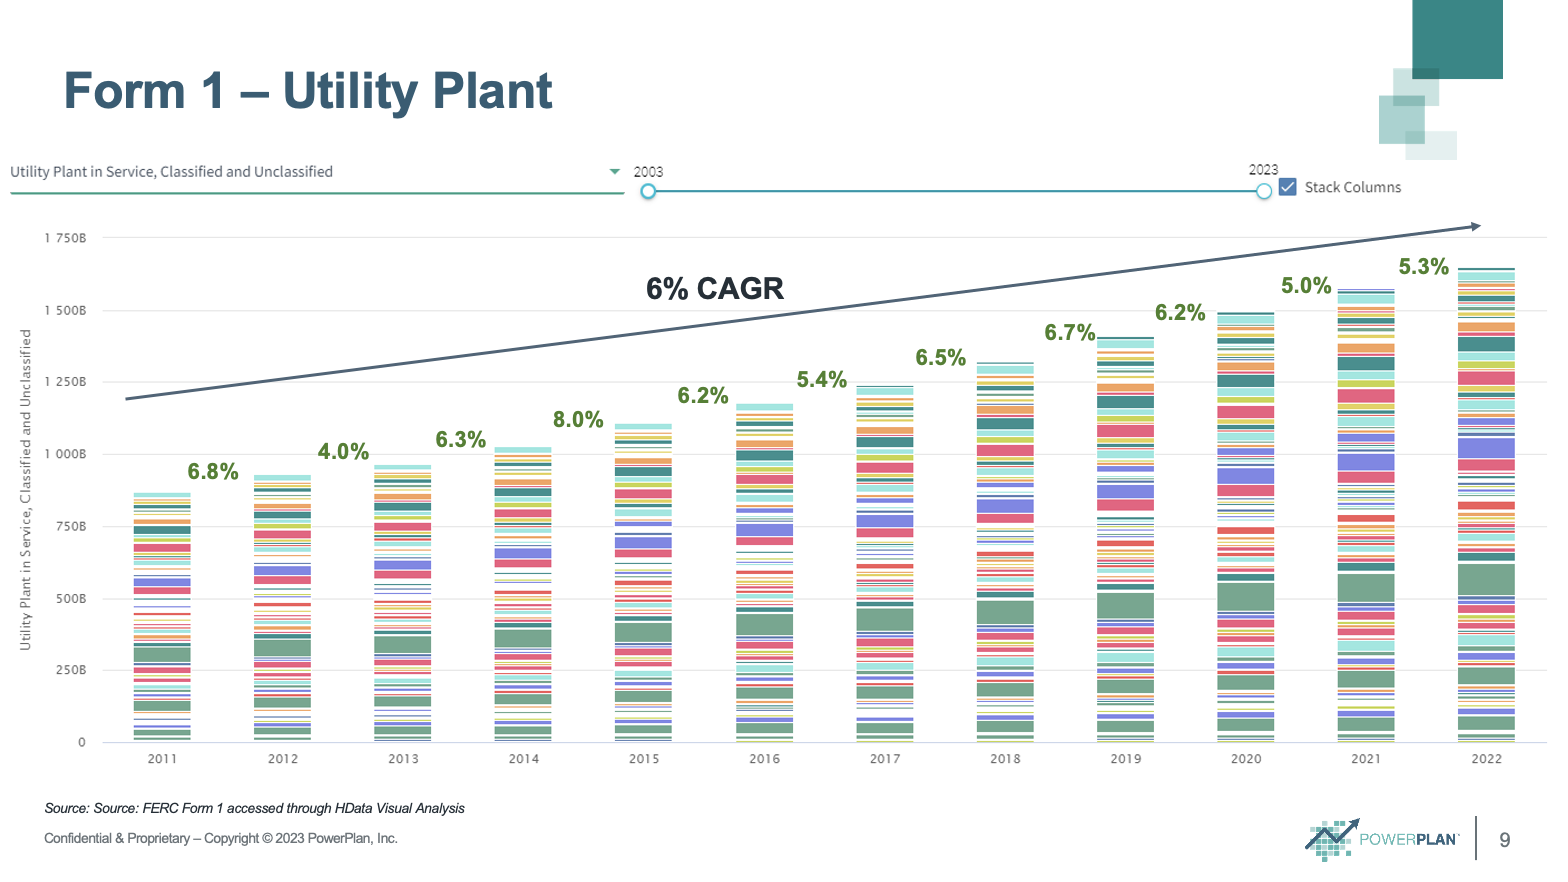
This HData chart shows the Property, Plant, and Equipment (PP&E) for FERC Form filers. We can see a compound growth of 6% over the last 12 years. This is tremendous, sustained investment growth in utility infrastructure.
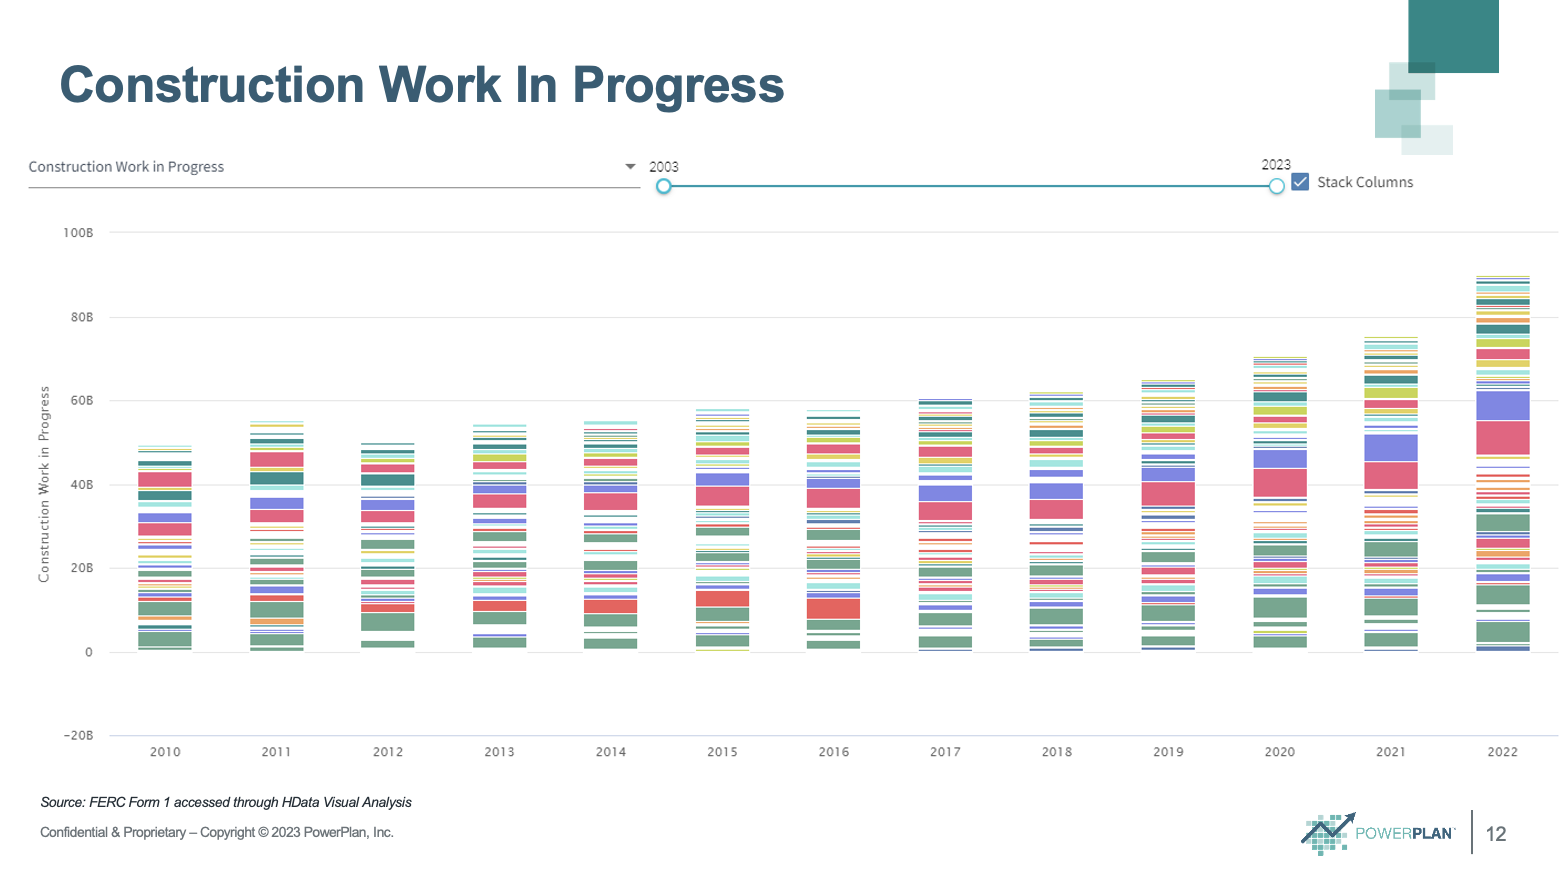
Following the view of sustained growth in PP&E in the previous slide, Construction Work In Progress represents investment in projects that are not yet complete and in utility service. This indicates not only little slow down in capital spending, but accumulation of spending throughout and continuing after the pandemic.
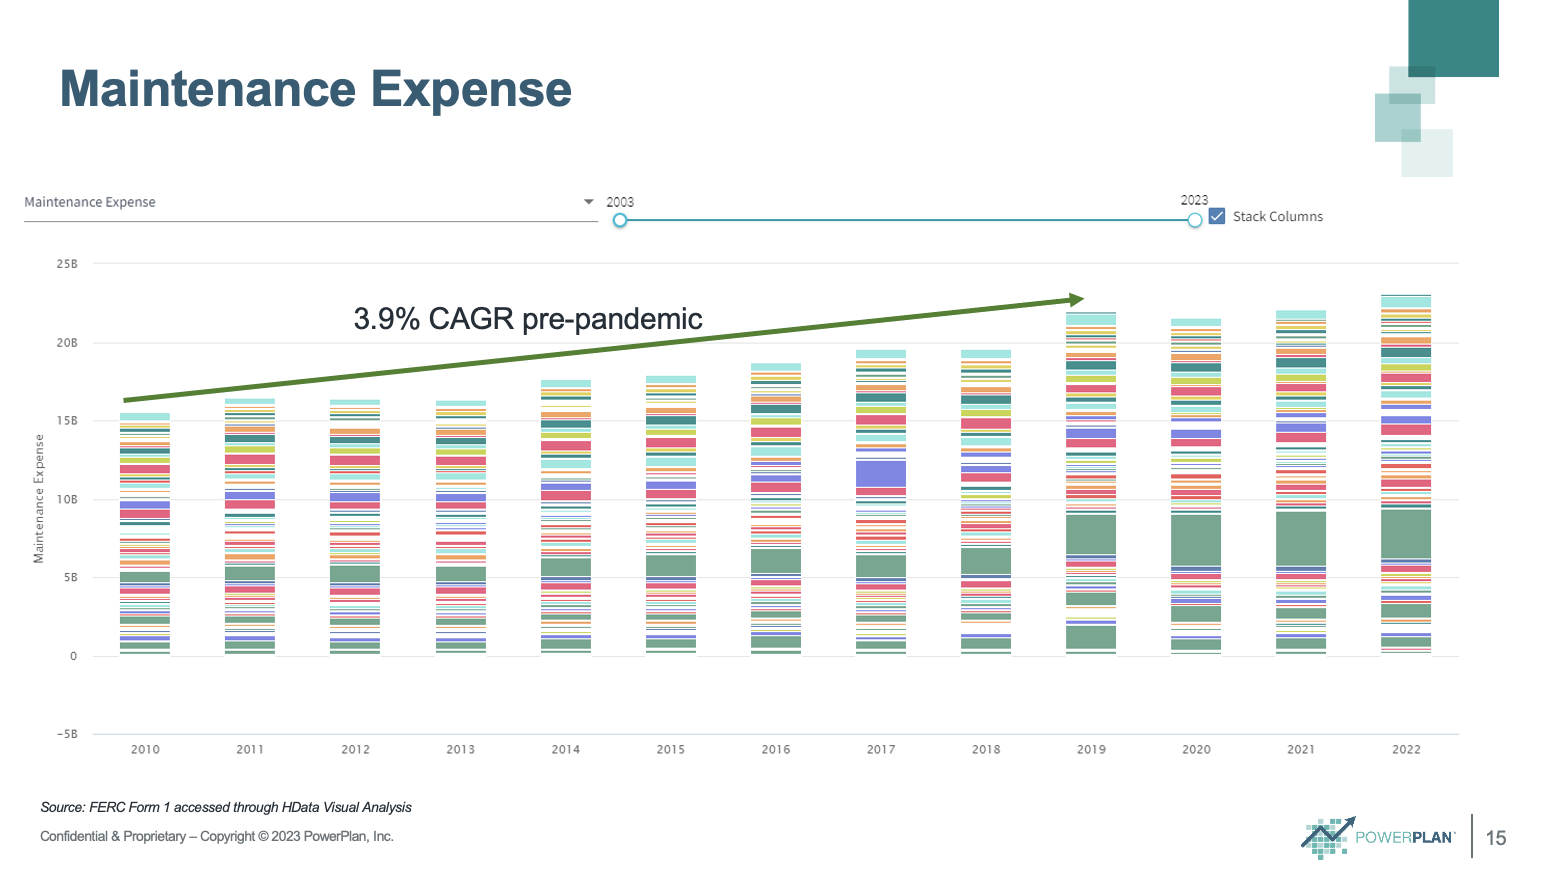
This HData chart shows Maintenance Expense for FERC Form filers, which leveled off during the pandemic. This is consistent with expectations since utilities focused on critical maintenance only to limit personnel exposure during the pandemic. It will be interesting to see whether utilities return to pre-pandemic spending growth levels, and if not, how that could affect future spending and reliability if maintenance spend is decreased for a prolonged period.
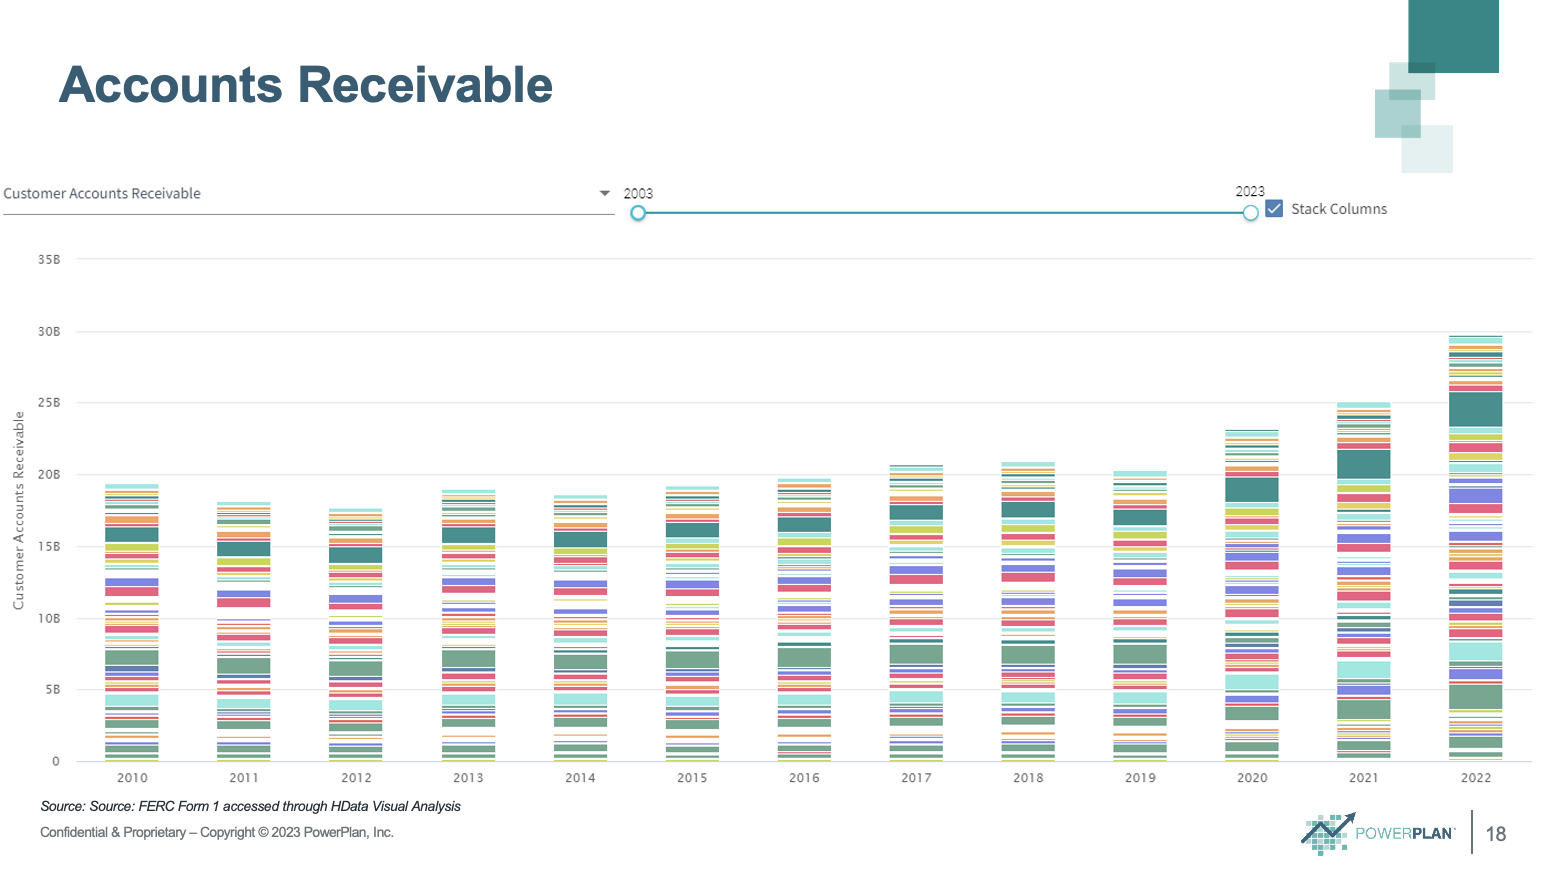
Accounts Receivable represents services or products provided to customers but the utility has yet to receive payment. During the pandemic, many jurisdictions instituted shut-off moratoriums (utility cannot disconnect or stop serving a customer for lack of paying their bills). However, accounts receivable balance still continued to rise after the pandemic.
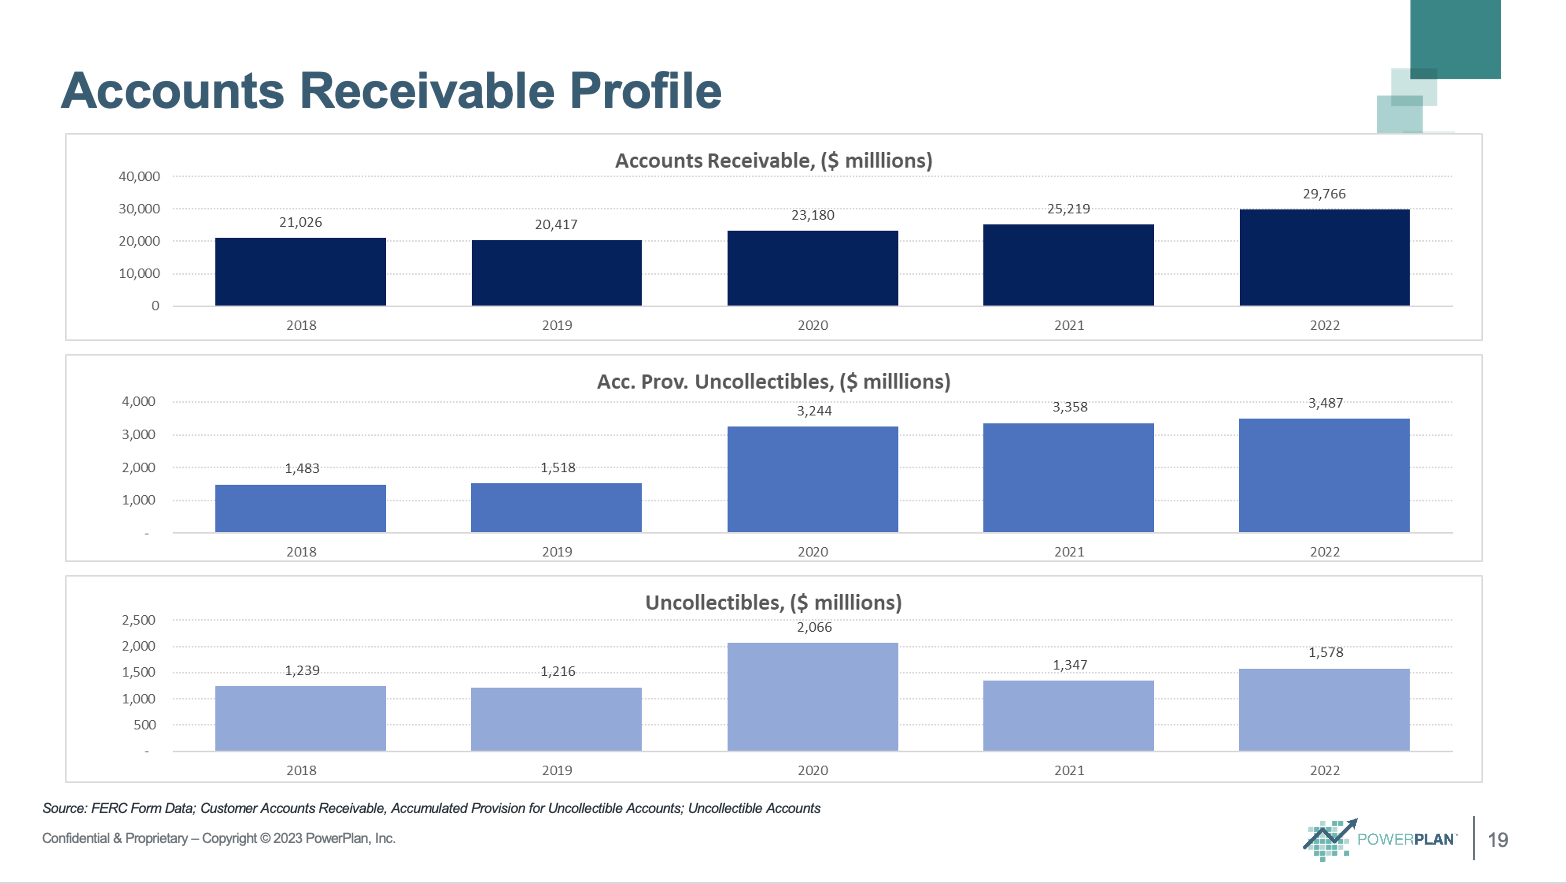
Data for this chart was exported from HData and summarized to create these visuals using Microsoft Excel. Uncollectibles represent a portion of the Accounts Receivable account that the utility expects will never be paid. This chart created a vibrant discussion during the presentation including potential causation.
Q: What kind of information did you showcase?
A: I focused on trends with rate case and riders, electric and gas demand, utility spending across CAPEX and OPEX, and finally, with balances in Accounts Receivable and Provision for Uncollectibles.
The presentation was a reflection of flat demand coupled with the recent history of rising costs. All of this is set on a backdrop of increasing requirements for additional spending over the next few decades to meet net-zero carbon objectives, diversity, equity and inclusion goals, and maintain an aging infrastructure (to name a few). At that point, utilities can consider the inability of customers to pay current bills (uncollectibles) that are continuing even after the pandemic circumstances and reflect on this trend in an inflationary and higher interest rate environment.
Q: How easy was that information to find? Which tools were most helpful for this project?
A: We already had the information on rate case and rider statistics, and HData made the rest of the presentation possible.
We were able to quickly and easily examine FERC form data for trends in utility O&M costs, key rate base drivers: Property Plant & Equipment (PP&E), and Construction Work In Progress that is a feeder account into PP&E.
The ability to examine multiple sets of data for trends or potential insights allowed me to curate the story with the slide content.
Q: Was there any information in the data that surprised you?
A: The data further confirmed the hypotheses I had of increasing capital spending with no indication of slowing down with high rate case frequency, and validated reports from industry leaders on an individual company basis.
Specific data points of surprise were the spikes in Construction Work In Progress in 2022 and the lack of decrease in the Provision for Uncollectibles following the pandemic.
Given that this is just data, we can speculate and then further research the actual causation. But the data on its own is interesting. I used these speculations to engage the audience and generate a discussion. Of course, that leads to further insights from the people that work in the industry.
Q: Was there any information in the data that you found especially helpful?
A: The ability to pull the data and examine it visually is what made it most helpful. The elements of data analytics that are most often time-consuming and challenging are data collection and validation. HData has already performed that work for me and connected to a visual analytics tool. This means time can be spent on analysis instead of data management.
Q: You're an expert in your field. How do you think your commentary and the data you presented worked together in this presentation?
A: The commentary is linked to the data. While I had some thoughts and anecdotal stories on certain trends, I didn’t have the full commentary for the presentation formed until I performed the data analysis. Regular consumption of news and industry articles informs a certain picture of the industry. From there, I reconcile or challenge the picture with personal observations and experience, plus insights from industry leaders. Data is just one component of understanding what’s happened. And it provides insight into what may come.
Q: Next time you're putting together a presentation for an audience, what role do you expect HData will play?
A: To be honest, it depends on the presentation. HData, with its expanding libraries of data and capabilities in artificial intelligence, is a core part of my toolkit. It allows me to keep up with industry insights, while also performing my own analysis to develop insights.
Are you ready to discover a whole new way of interacting with regulatory data? Register a free HData account and gain access today.